Quantifying Heart Rate with Laser Speckle Imaging
Background
I worked with Shinnosuke Fukazawa at the Microvascular Therapeutics and Imaging Laboratory.
Our project consisted of investigating laser speckle
imaging to quantify heart rate from the finger or wrist (think of the
Apple Watch or other smartwatches).
Laser Speckle Imaging
The theory behind laser speckle imaging consists of a phenomenon where speckles are produced when coherent light (lasers) is directed at biological tissue. Also important is the fact that the movement of blood causes these speckles to blur.
Image processing of the blurring of speckles can reveal valuable physiological information.
Furthermore, there are several techniques involved with laser speckle imaging such as spatial or temporal.
Our project consisted of employing temporal contrast.
The Math: Speckle Contrast
Speckle contrast $K$ can be defined as follows:
\[K=\frac{\sigma}{<I>},\]where $\sigma$ is the standard deviation of an $n$x$n$ window of pixels and
$<I>$ is the average intensity.
So how does this work in practice?
Imaging Processing for Heart Rate
In order to quanitfy heart rate, Shin and I directed a near-infrared laser at a finger or wrist and collected a video.
Once we have a video, then we can being to process the images:
- The speckle contrast of each pixel is calculated using a 7x7 window.
- Repeat Step 1 for all images within the video.
- Now, we have a series of images composed of speckle contrast.
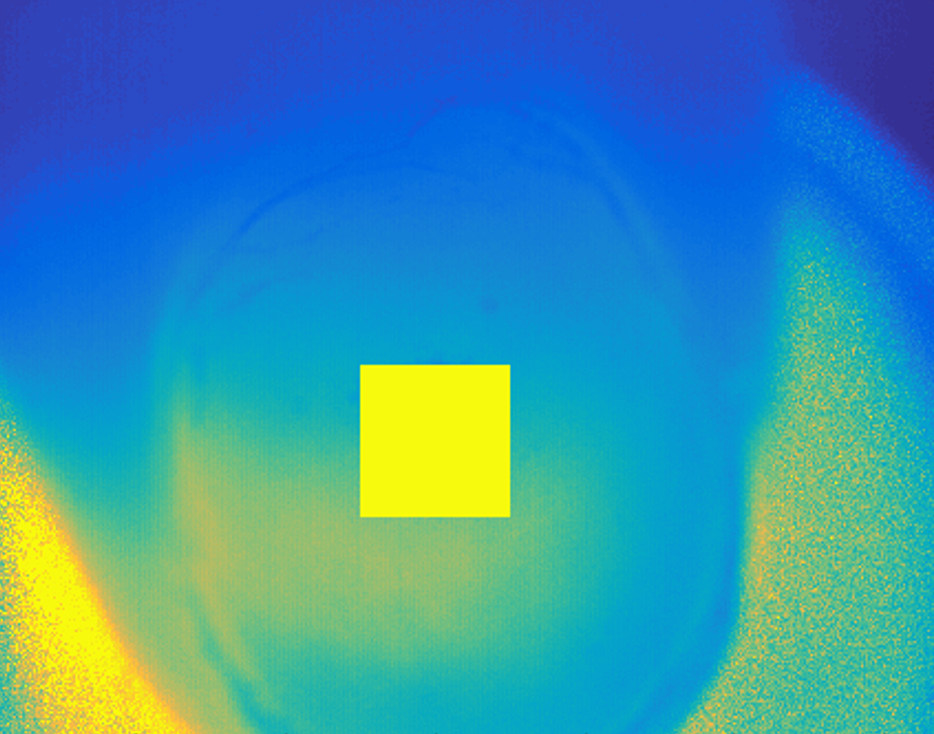
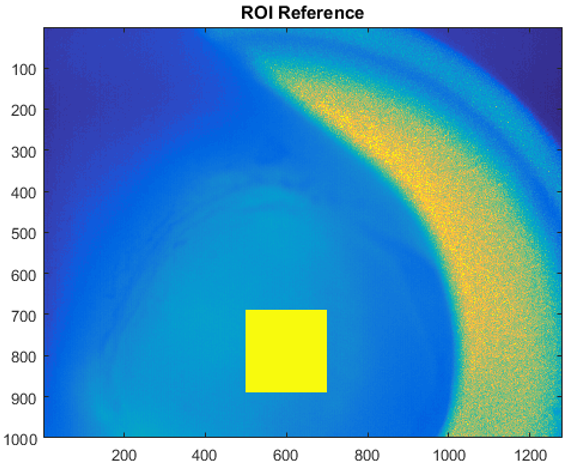
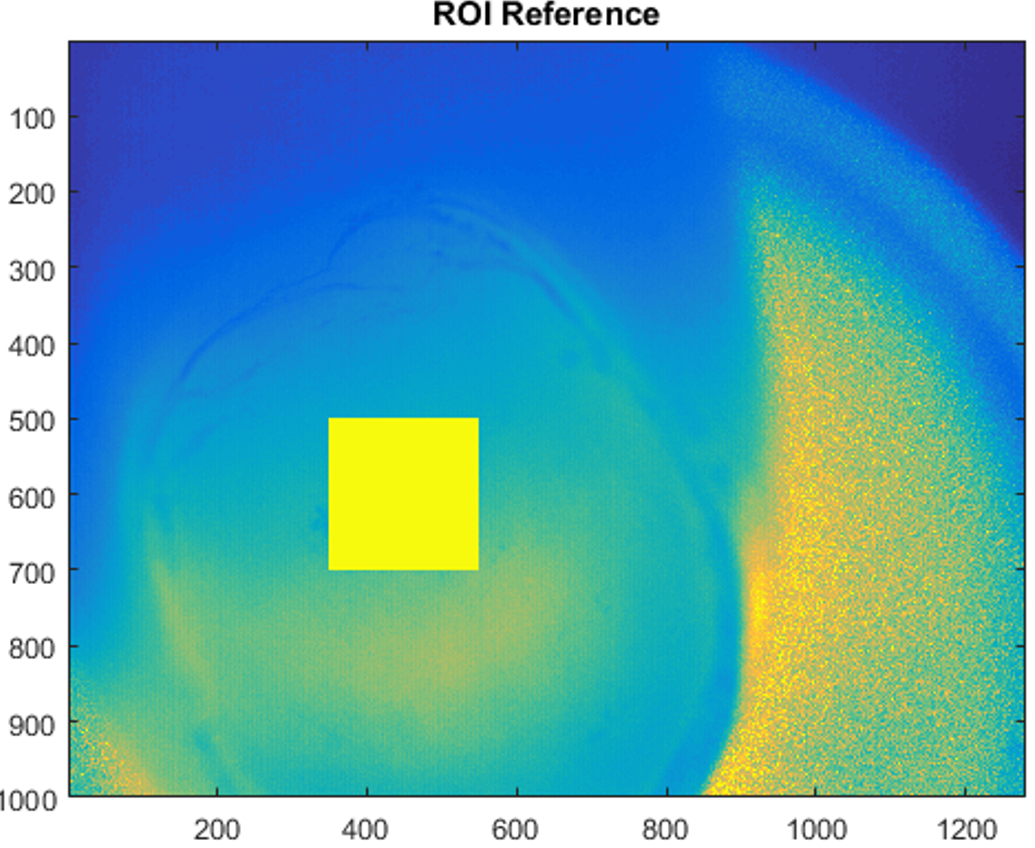
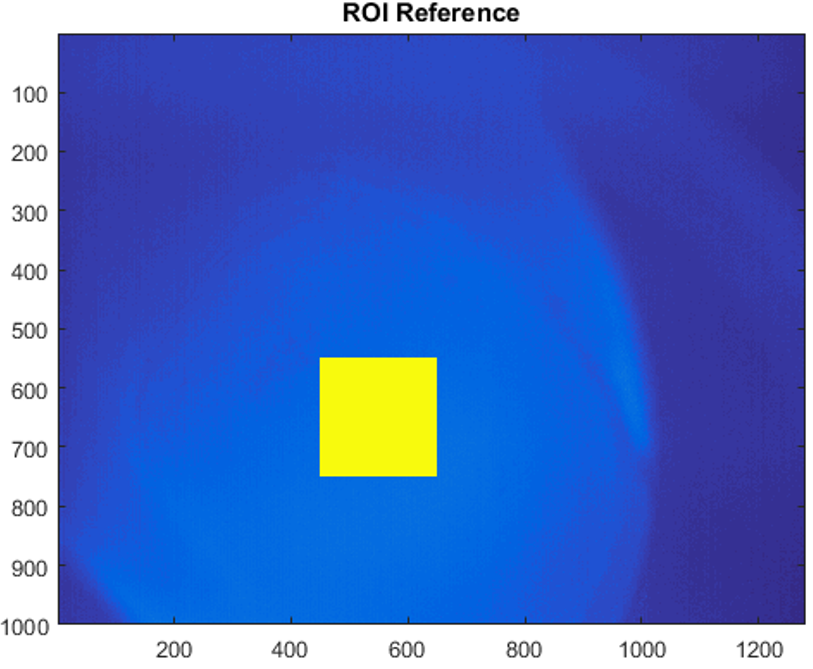
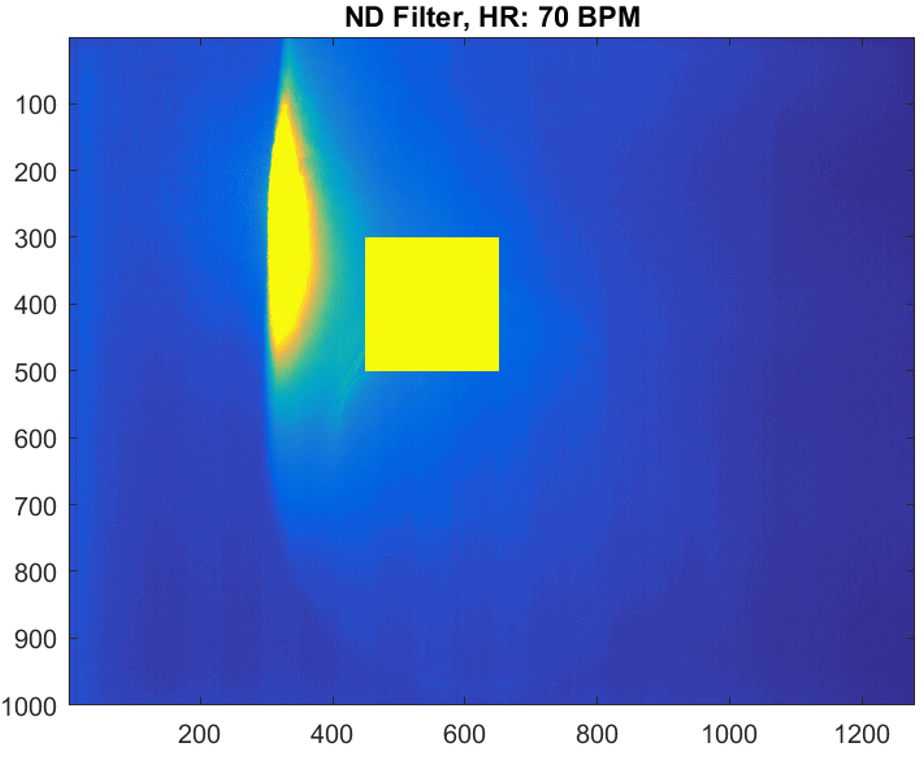
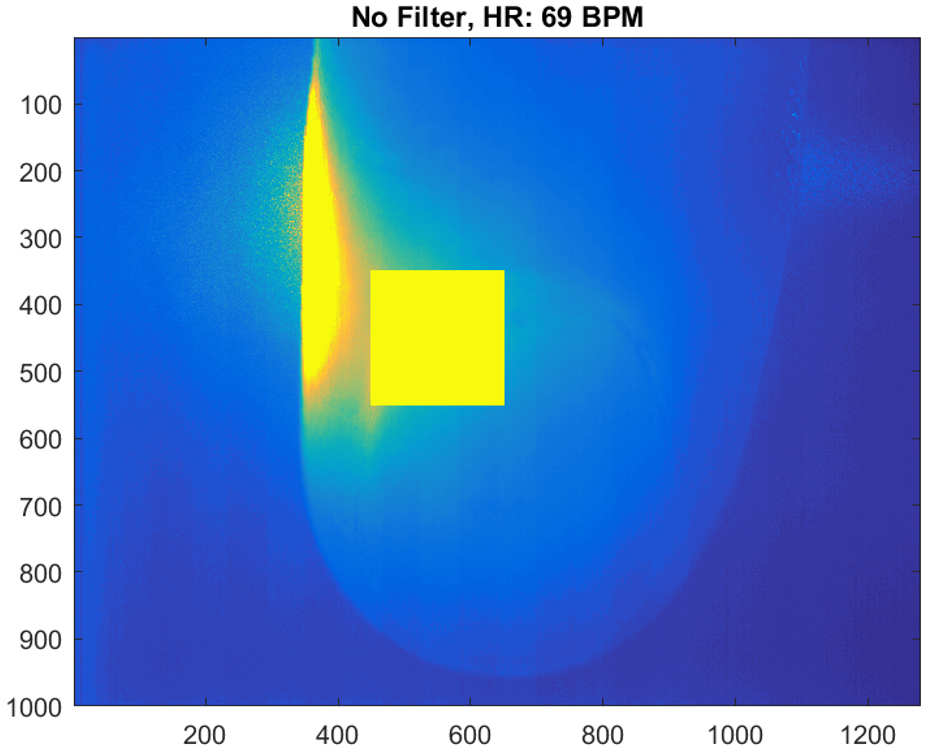
- A region of interest (ROI) is chosen for each video, as shown in yellow above.
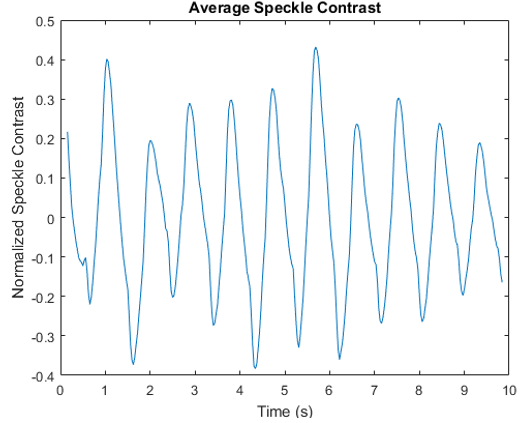
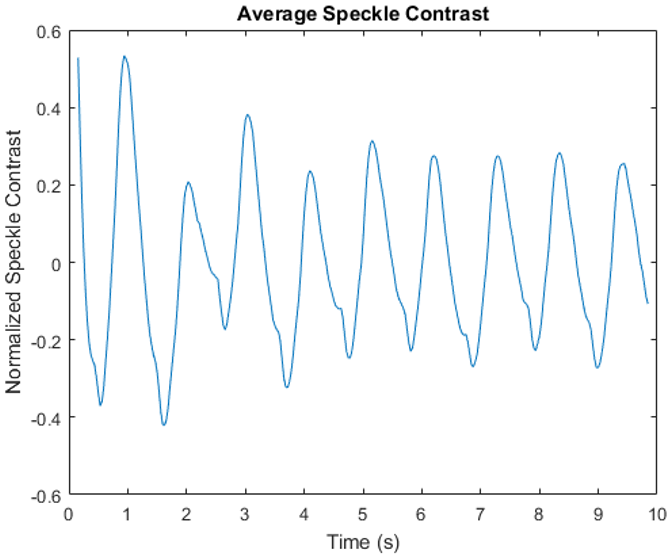
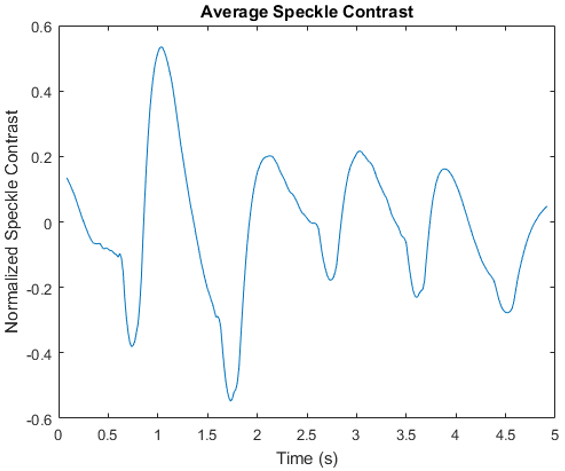
- We then calculate the average speckle contrast over time within the ROI.
- Smoothen the signal by applying an 11-point moving average window to the average speckle contrast.
- Detrend the data.
- Normalize the average speckle contrast from -1 to 1.
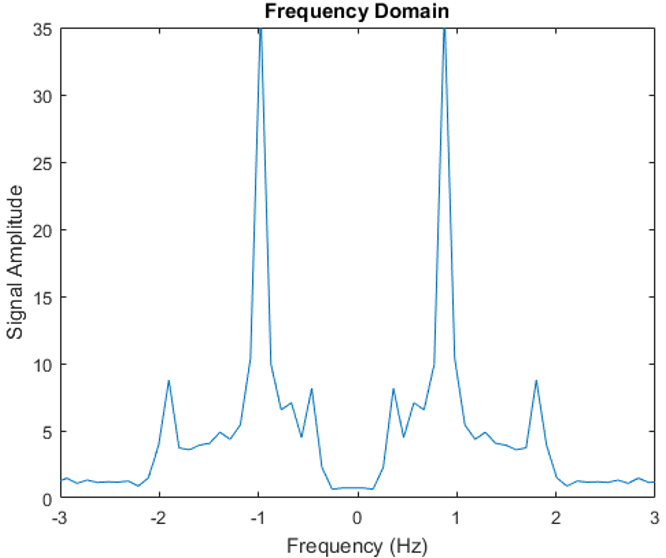
Which gives us the result below.
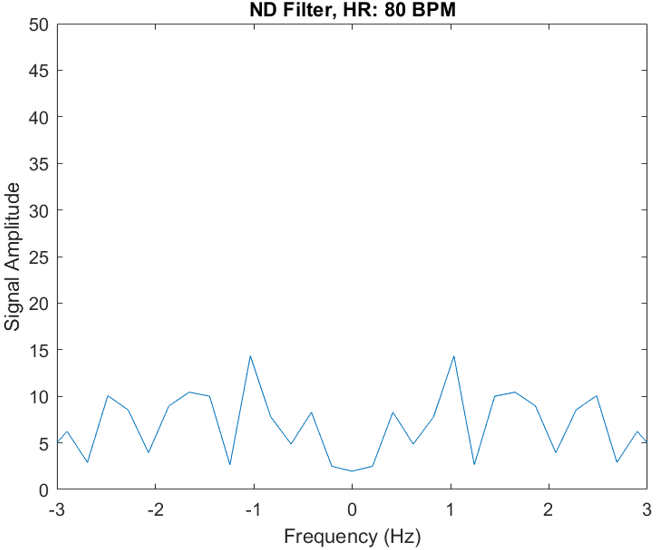
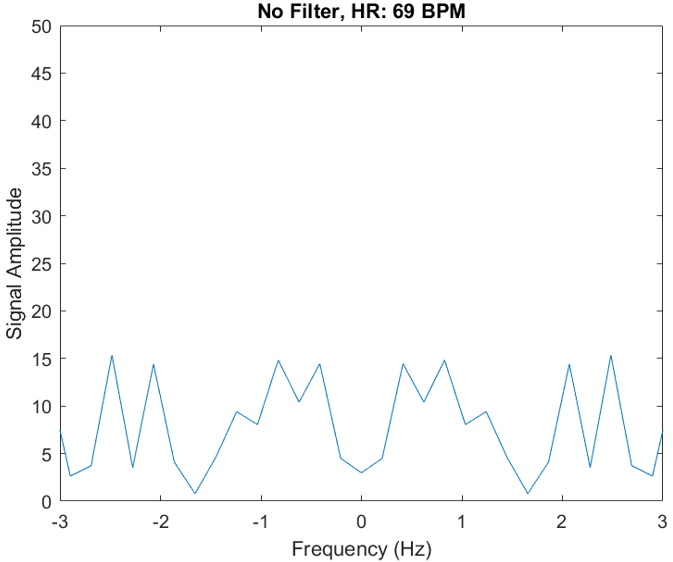
- Convert the data to the frequency domain.
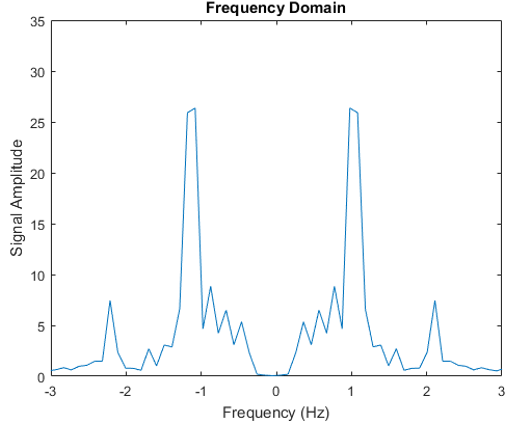
- Finally, the frequency (Hz) of the peaks in the image above can be converted
to beats per minute (bpm) to quanity heart rate.
Finger Measurements
Investigating the Effects of FPS
As part of our project, we investigated the effects of the video’s frames per
second (fps) on the measured heart rate.
32 FPS
60 FPS
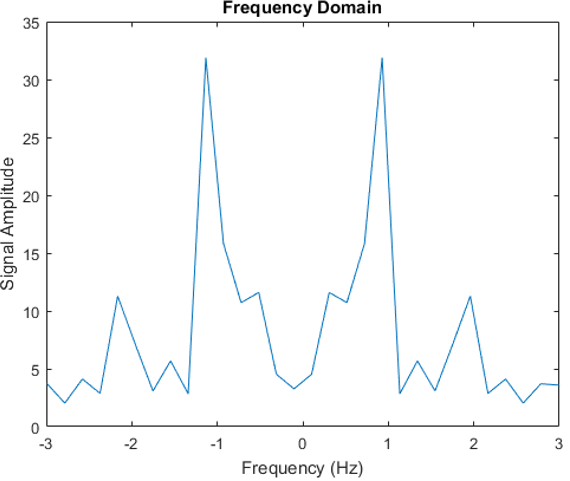
In this particular experiment, we observed a stronger signal for the 32 fps trial; the peaks within the frequency domain are much more prominent than the peaks in the 60 fps trial, when compared to the rest of the signal.
This suggests that the measured heart rate may have been more accurate in the
32 fps trial.
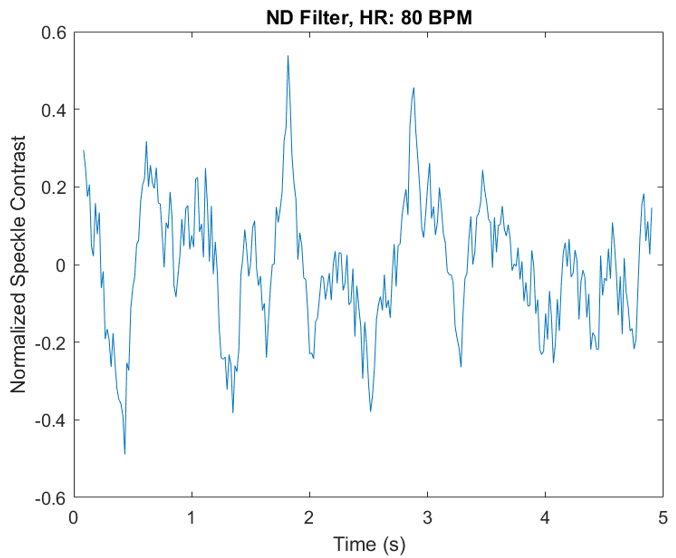
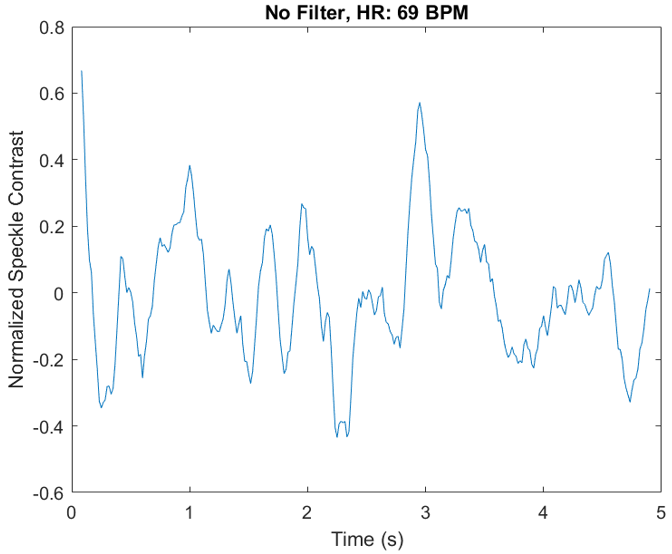
Investigating the Effects of a Lens Filter
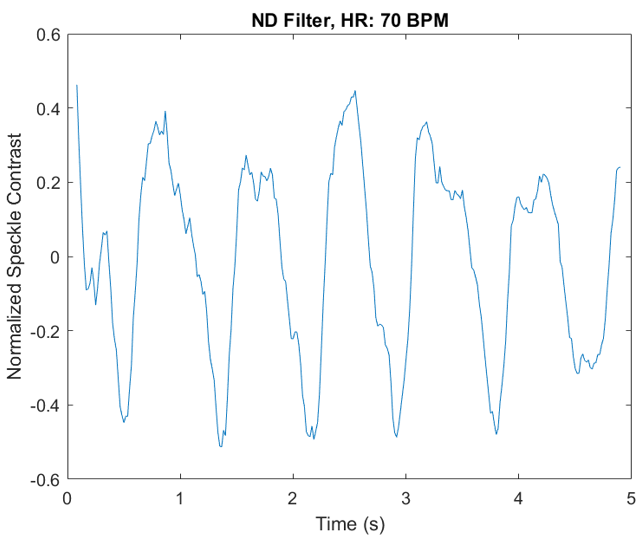
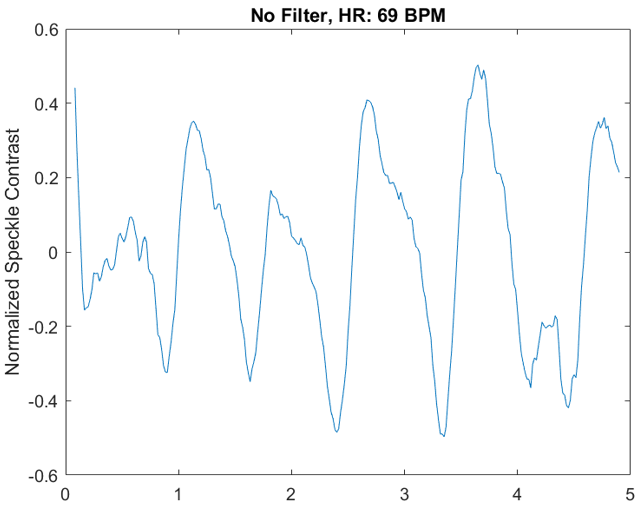
We likewise investigated the effects of a neutral-density (ND) filter on the
measured heart rate. An ND filter, when applied to the camera, reduces the
intensity of all recorded light.
Daniel’s Finger
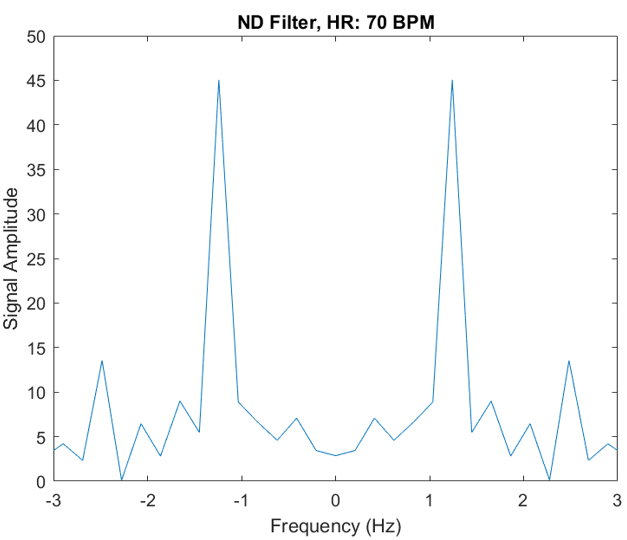
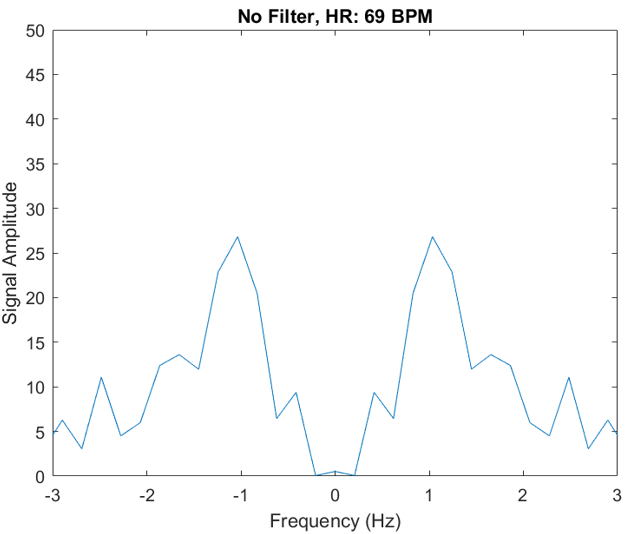
In an experiment with my finger, both trials resulted in approximately the same heart rate, but the trial with the ND filter had less noise overall.
However, we then proceeded to observe the opposite behavior in an experiment with Shin’s finger.
Shin’s Finger
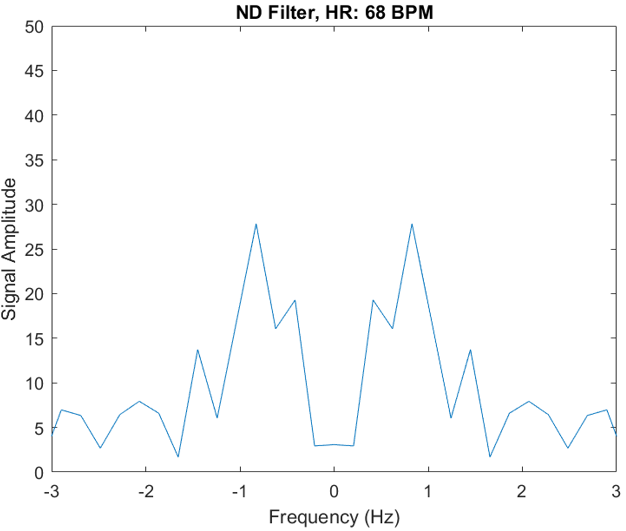
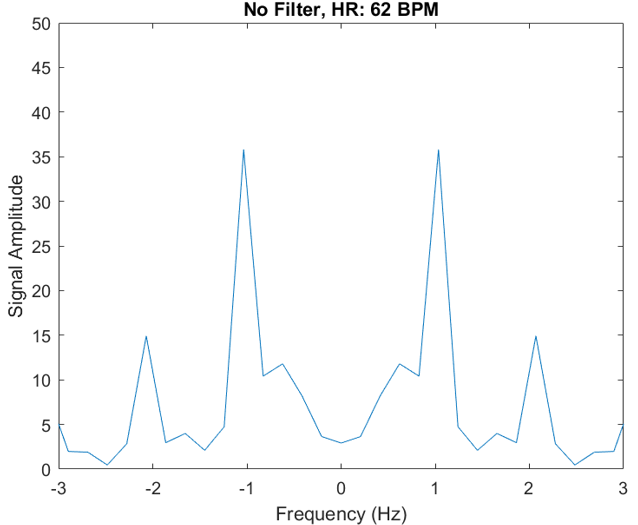
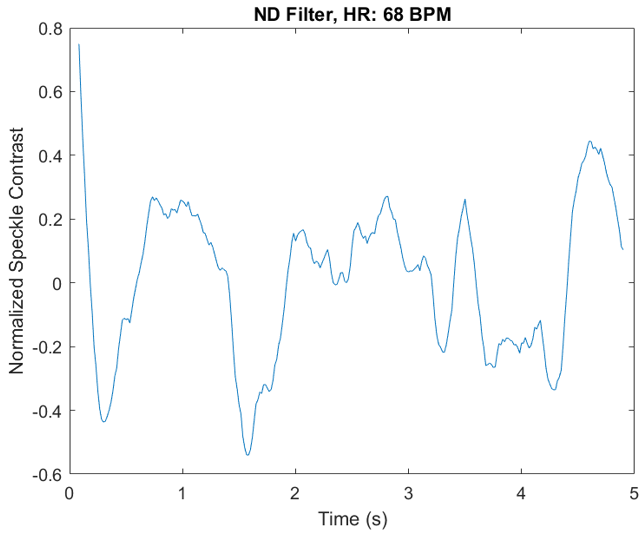
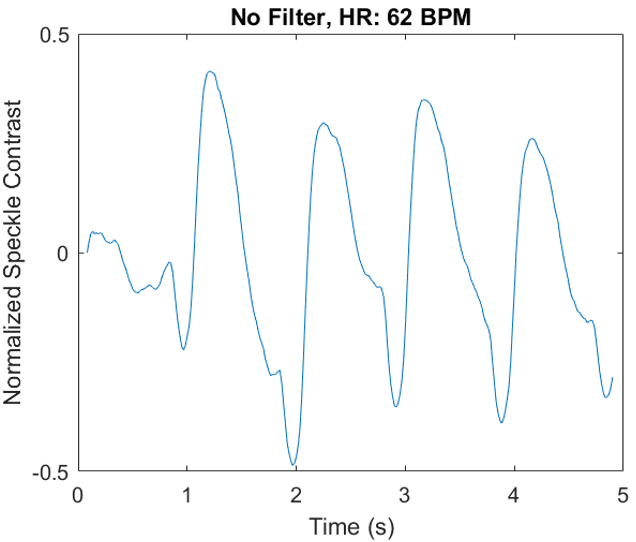
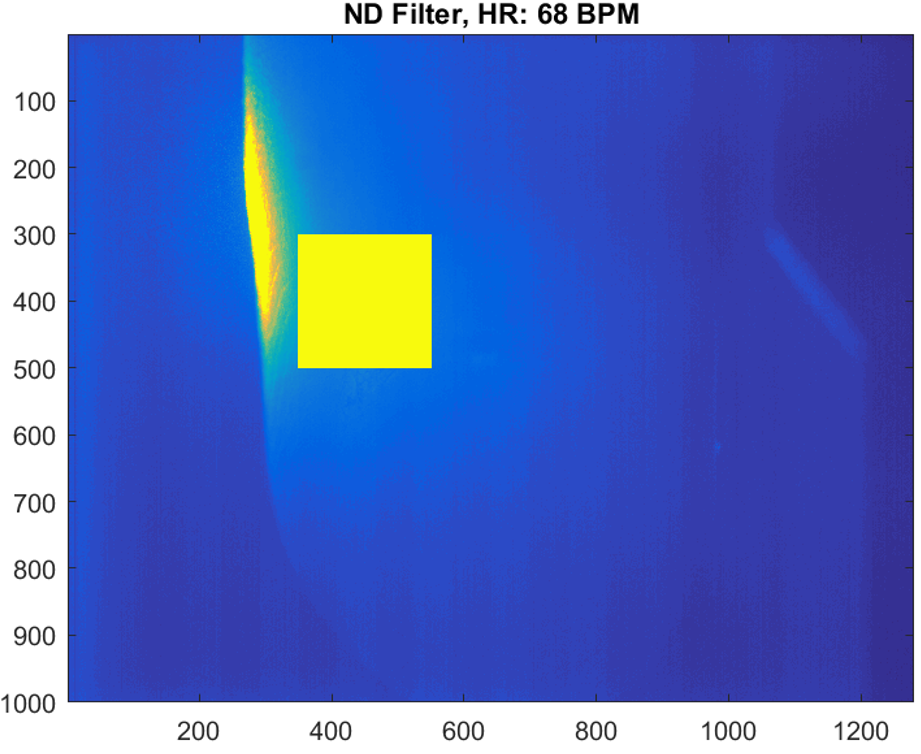
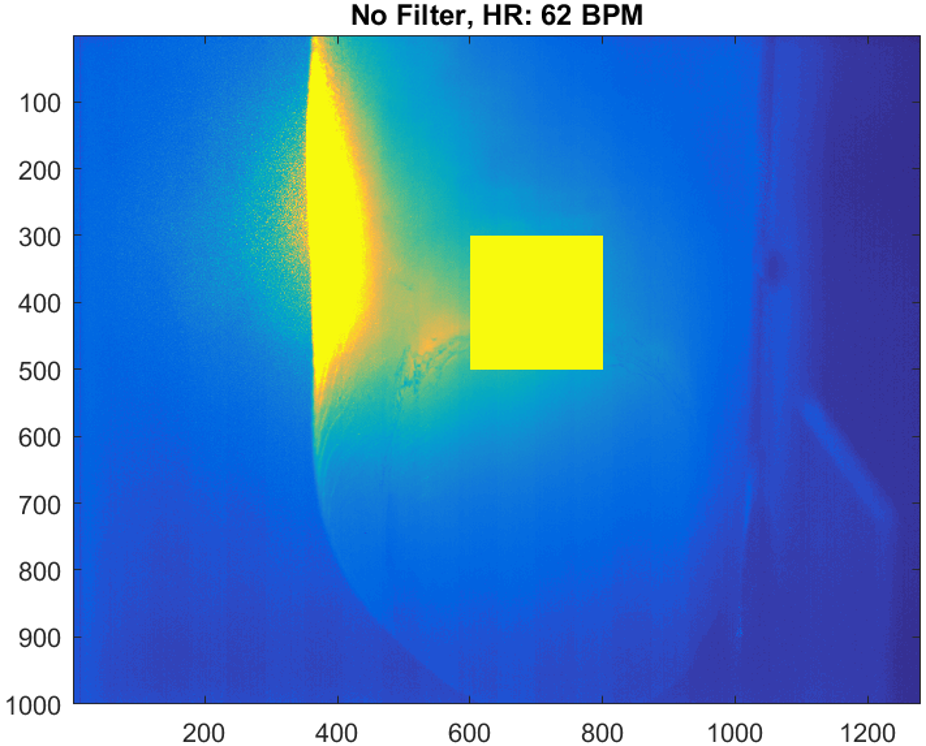
In the experiment with Shin’s finger, the trial without a filter had less noise.
We hypothesized that the difference in observed behavior may have originated from our choice of ROI in the no filter trial.
The ROI chosen is shifted further to the right than the ROI in the
corresponding trial for my finger.
Wrist Measurements
We replicated the same experiment for the wrist concerning an ND filter.
Here, we observed much noisier signals than from the finger.
This observation may derive from how there is less bloodflow in the wrist than in the finger, thereby resulting in a noisier signal.